
Debugging on an ARM device
I had the arduous/priviledged task of repurposing an ARM-based device over the last couple of weeks. On the negative side, I made a few silly mistakes that would've been obvious to someone more seasoned. On the other hand, I learnt a lot about various tools that can help with debugging that in many cases cross over to general x86 work.
The idea itself was simple enough; to interface to another device over serial; I'll call this the recbox for brevity. I would send commands to the recbox which would initiate a data dumping sequence which I would read and store on the repurposed device. Simple enough. The transfer was done using the Xmodem protocol, which I had implemented a few months prior in anticipation of this job.
Firstly, I took the original OEM software and sniffed the serial traffic to see how it initiated the transfer. Once I had performed this easy task, it was simple enough to modify my existing code to start a transfer. I test this code by compiling for x86, and everything checked out. I confirmed the data was transferring correctly.
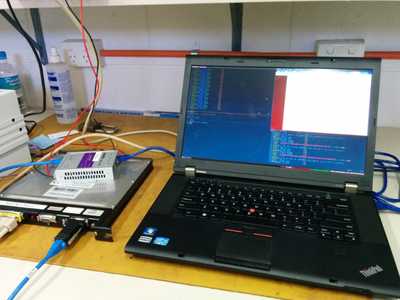
Now came time to test this on the ARM box. Oh boy, this took me most of the week to sort out. Cross-compiling was easy enough - the manufacturer of the device provided a complete toolchain. Transferring to the box could be done over ftp, and it provided a telnet interface for interacting with the shell on the box.
Now the fun was to begin. The program didn't work as expected. The manufacturer has also not bothered to have precompiled any debugging tools for the device. So naturally, that was the first step.
I compiled gdb and gbdserver and got it up and running by following instructions laid out here on C Plus Add. With this I was able to start stepping through the program. There were some issues with the serial library I was using - timeouts that weren't prone to occuring on my i7 laptop were likely happening on my ARM box. Some quick changes would fix that.
Unfortunately, this did not resolve my issues. Going back through the debugger, nothing lept out as being wrong. Time to cross-compile strace. For those who have never used it, strace is a utility for determing what system calls a running process is executing. This is particularly useful for detecting what reads/writes are actually occurring.
Once strace was up and running and attached to the process the picture started becoming a little bit clearer. My reads were returning some rather odd behavior. In the third column of the read call, I would expect it to show the lengths of my data packets (normally [1029]) over and over again making reads to the serial port. This number was however, not 1029, and was a random bunch of other numbers generally just a bit lower than 1029. This was the smoking gun.

A little bit of note on this device - it has two serial ports, and originally was used in some sort of gps based device. Initially, I changed the serial ports to see if it was some sort of hardware issue on the first port. The problem remained. I would like to point out that I thought I had a completely clean device, stripped of it's original purpose - this was not the case.
I looked up the list of processes and noted a few running that were not standard linux processes. I noted one called dgpsconv - what I imagine means differential gps convolution. At this point, it was quite obvious something else was reading from the serial port at the same time. I killed the process and after a little more debugging everything worked as it should.
At this point, it is important to note the roles gdb and strace played in debugging a problem that I could not have really solved with placing print statements everywhere. I did find another linux command that would have helped - that of lsof. This would have told me straight away whether there were any processes writing/reading to the serial ports. Unfortunately, much like strace and gdb, this was not provided by default on the target board.
So what is the takeway from this? strace and gdb should form the strong core of your debugging efforts, although having a full suite of standard linux utilities is very helpful!

About the Author
Matt Tyler is a software engineer & cloud tragic working @ Mechanical Rock. He helps teams get the most out of their cloud development experience.